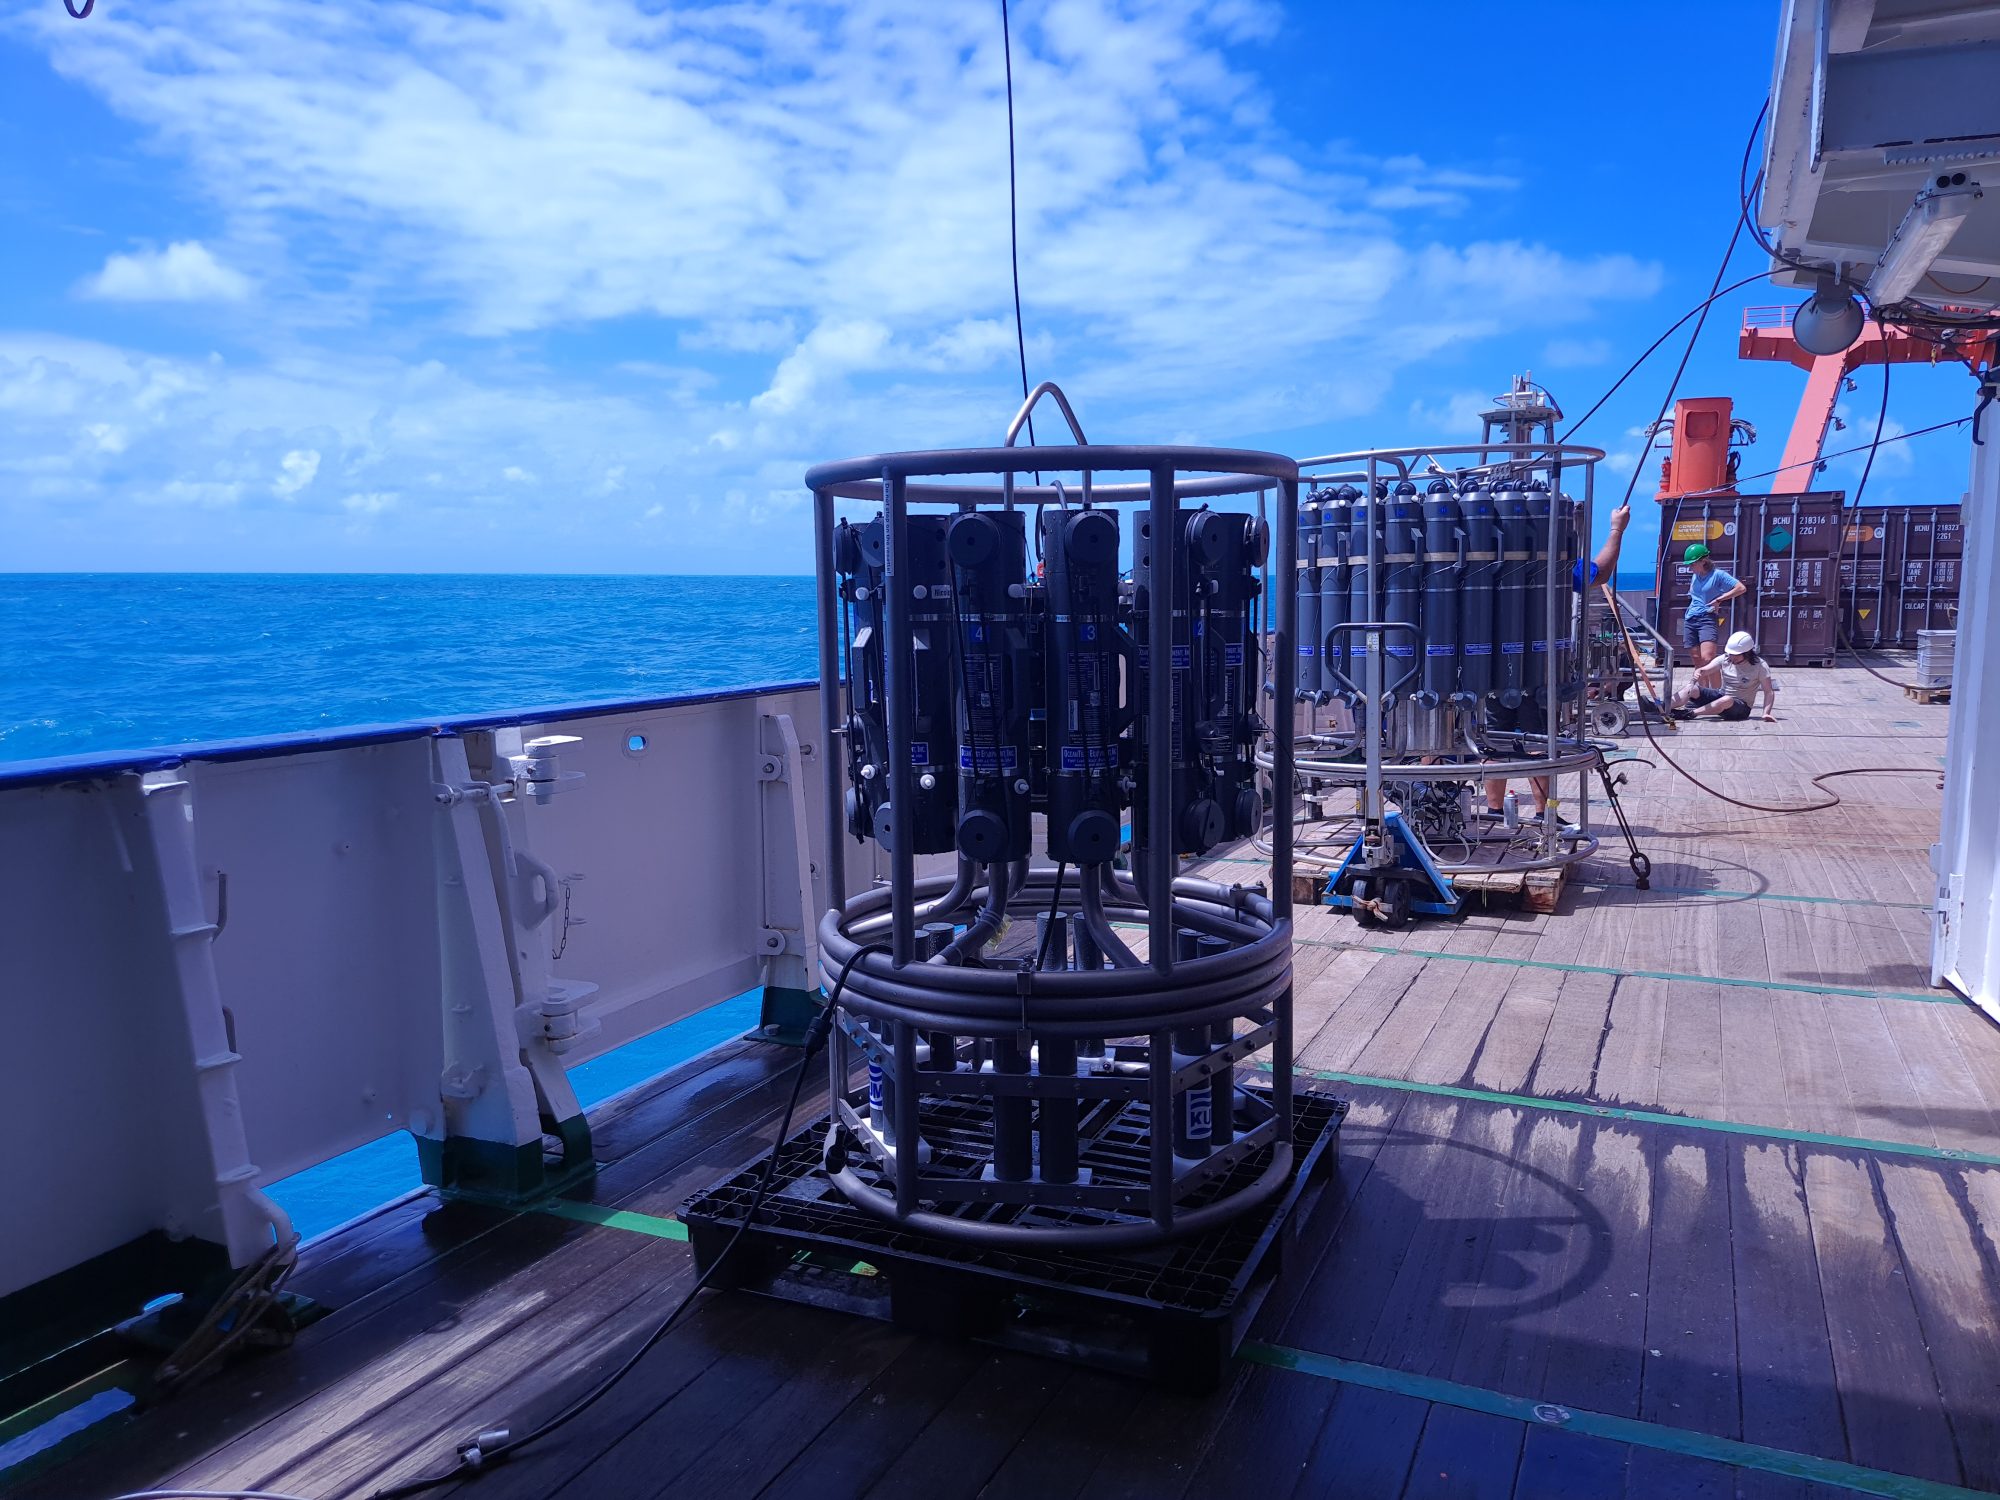
Although we have had a few minor problems with first use of the sampling equipment, this is budgeted for in the station planning, and everything is now tested and functional. Things can still go wrong when dealing with sensitive equipment, but everyone is confident that any small problems can be speedily dealt with.
Today and tomorrow, we will be working with all the main sampling instruments: the CTD, the MUC, the BWS, TM-CTD and the tow fish (all pictured). There are two great short videos that show the mechanisms of the MUC and the CTD in operation underwater – one from the Schmidt Institute, here; and the other from Geotraces/PolarTREC, here.
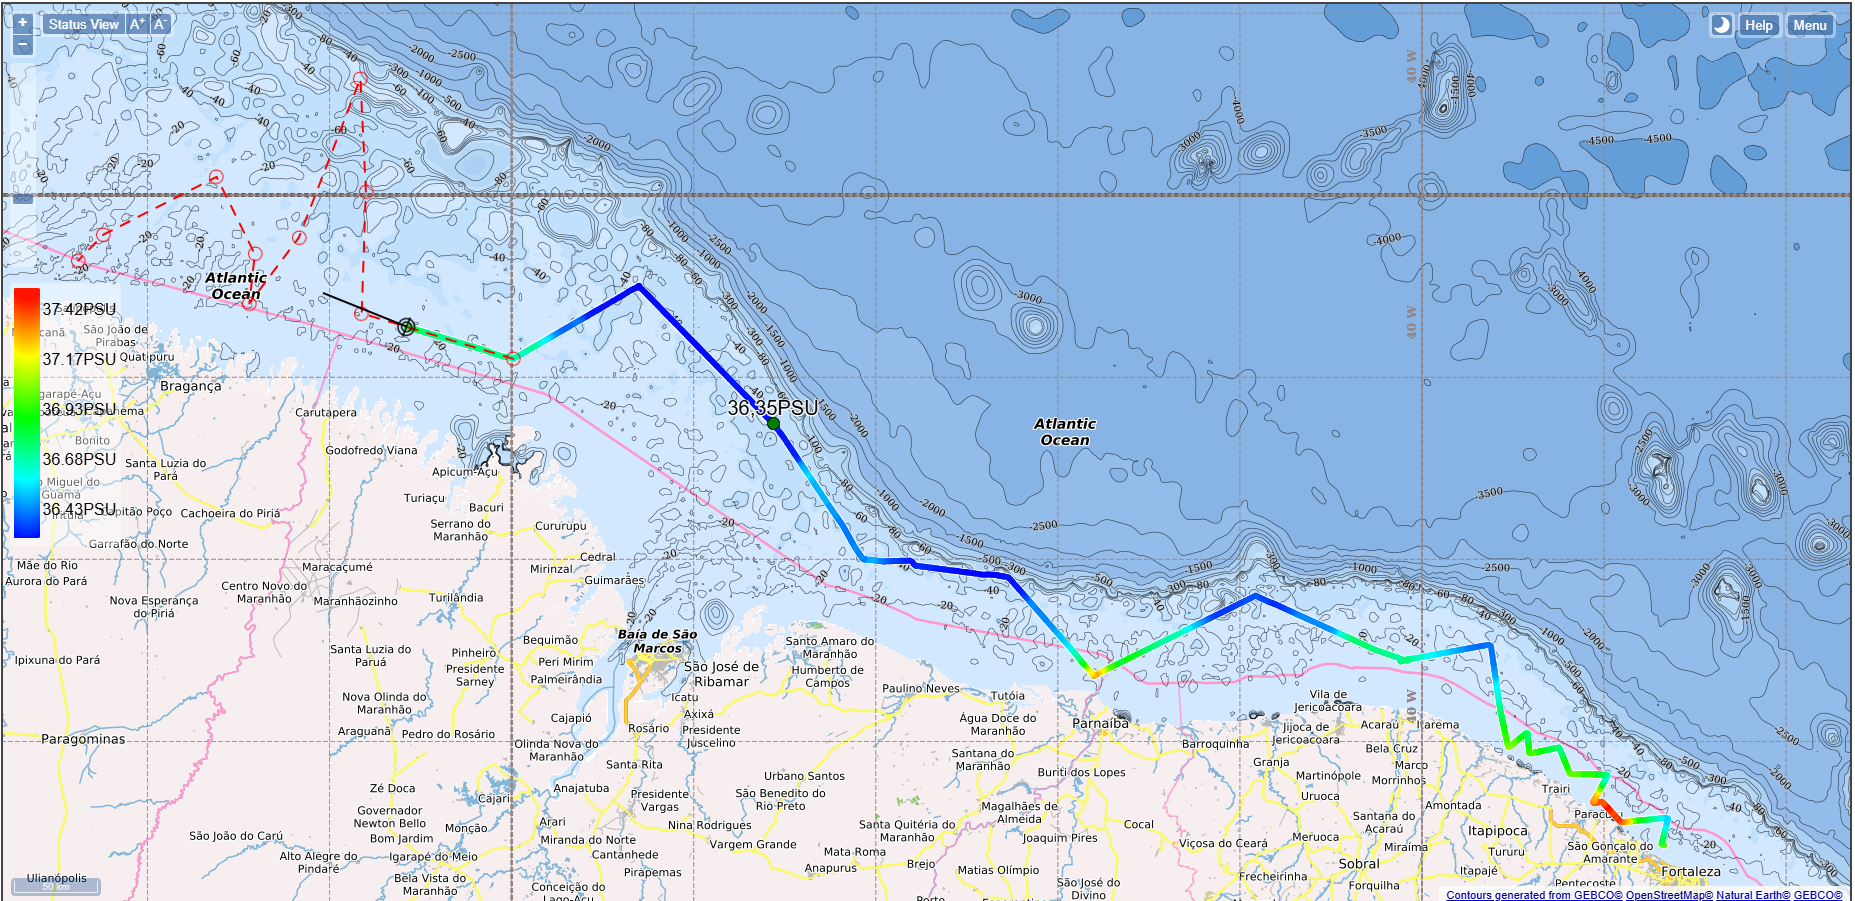
We have moved now approximately 300nm (550km) west long the coast, zig-zagging in order to sample along the salinity gradient. It is interesting to see that the salinity is extremely high close to the mangrove coastline (on the map, red is most saline and blue is least saline): it is not clear whether this is a normal condition during low water or is exaggerated due to the extreme drought experienced in the Amazon region this year.